
Predicting Currency Crises in Emerging Markets: A CART-Based Early Warning System
1. This project has a major limitation of low number of crises. I intend to perform another project on this topic using a better prediction model for a large sample size of crises by utilizing more countries' data.
Stay tuned!
Project Overview
This project investigates the causes and dynamics of currency crises in emerging markets.
The main goals were:
- Analyze historical cases to identify triggers and warning signs of currency crises
- Explore theoretical models explaining crises, such as policy missteps and external shocks
- Visualize economic indicators and policy responses during crisis periods
The analysis uses macroeconomic data and crisis case studies to highlight patterns and inform policy recommendations.
Introduction
Currency crises have repeatedly disrupted emerging market economies, often triggering severe economic, social, and political consequences. Identifying early warning signals of such crises is a central concern for policymakers, international organizations, and investors. In recent decades, an extensive literature has developed around crisis prediction models, with varying degrees of sophistication and success. This paper builds on that tradition by applying a Classification and Regression Trees (CART) approach to construct both pooled and country-specific early warning models for five major emerging markets: Argentina, Brazil, Indonesia, Mexico, and Turkey.
We focus on a set of macro-financial variables documented in the literature to be associated with crisis susceptibility, including real exchange rate overvaluation, credit growth, current account imbalances, short-term external debt, reserve adequacy, and global interest rates. We find that the predictive power of these variables varies substantially across countries, highlighting the importance of tailored risk assessment.
Literature Review
Theoretical and empirical studies on currency crises have changed over several generations of models:
- First-generation models (Krugman, 1979) focus on fiscal deficits and macroeconomic inconsistencies as main causes of currency crises.
- Second-generation models (Obstfeld, 1996) point to self-fulfilling expectations and multiple equilibria, where crises can happen even without clear macroeconomic imbalances.
- Third-generation models (Krugman, 1999) include weaknesses in the financial sector, balance sheet mismatches, and vulnerabilities in the capital account.
Empirical early warning systems (EWS) have usually depended on threshold signaling (Kaminsky, Lizondo, and Reinhart, 1998), probit/logit regression (Berg & Pattillo, 1999), and more recently, machine learning methods like CART (Frankel & Saravelos, 2012), random forests (Alessi & Detken, 2011), and neural networks (Demyanyk & Hasan, 2010).
Among the predictors, real exchange rate overvaluation has been one of the strongest signs of a crisis (Kaminsky & Reinhart, 1999). Other common predictors include rapid credit growth (Mendoza & Terrones, 2008), large current account deficits, increasing short-term external debt, and declining reserves (Eichengreen, Rose & Wyplosz, 1996; Gourinchas & Obstfeld, 2012).
Data
Our sample includes annual data for Argentina, Brazil, Indonesia, Mexico, and Turkey, covering about 1957 to 2025, with availability varying by country. The dataset has:
- Real Exchange Rate Overvaluation: This is calculated as the percentage difference of the real exchange rate from its HP-filtered trend. Overvaluation is important because ongoing deviations from balance can indicate vulnerability.
- Credit Growth: This shows the year-on-year percent change in domestic credit to the private sector.
- US Interest Rates (GS_10): This represents the 10-year US Treasury yield, which reflects global financial conditions.
- Current Account Balance to GDP (CAB_GDP): This serves as a measure of external imbalances.
- Short-term External Debt (ST_Debt): This is shown as a share of GDP, indicating rollover risk.
- Reserve to Broad Money Ratio: This measures reserve adequacy.
We define crisis events as years when real exchange rate overvaluation exceeds 15%, following Kaminsky and Reinhart’s work from 1999. We also test alternative thresholds for further validity.
| Country | Data points | Crises | Crisis rate |
|---|---|---|---|
| Argentina | 64 | 8 | 12.5% |
| Brazil | 47 | 4 | 8.5% |
| Indonesia | 58 | 3 | 5.2% |
| Mexico | 69 | 4 | 5.8% |
| Turkey | 69 | 4 | 5.8% |
Table 1: Crisis Distribution by Country
The dataset is moderately imbalanced, with relatively few crises compared to tranquil years.
Methodology
Variable Construction
Dependent variable: Currency Crisis Dummy
- Crisis = 1 if real exchange rate overvaluation > 15%, else 0.
Independent variables (all lagged by 1 or 2 years to prevent look-ahead bias):
- Overval_pct_lag1, Overval_pct_lag2
- Credit_Growth_lag1, Credit_Growth_lag2
- GS10_lag1, GS10_lag2
- CAB_GDP_lag1, CAB_GDP_lag2
- ST_Debt_lag1, ST_Debt_lag2
- Reserves_M2_lag1, Reserves_M2_lag2
- credit_growth_change, us_rate_change, and binary flags for high risk states
Modelling Technique
We use the Classification and Regression Trees (CART) algorithm, a non-parametric decision tree approach, for both pooled and country-specific models. CART is well-suited for capturing nonlinear interactions and threshold effects. Given the limited number of crises, we employ simple models (max_depth=3) and adapt the crisis threshold for each country to ensure at least two crisis events per sample. Where possible, we use grid search and cross-validation (CV). Otherwise, a simple out-of-bag or random split is used.
Model Evaluation
Performance is assessed using:
- AUC (Area Under ROC Curve)
- Classification report (precision, recall, F1-score)
- Feature importance from the decision tree
Results and Findings
Pooled Model
The pooled model across countries has a cross-validation AUC of 0.676 and AUC of 0.944 for the test data. The results indicate a solid fit within the sample data but imperfect performance when generalized to the test data, likely from a low number of crisis years experienced by countries after 2010. The best predictor variable was the 2-year lagged overvaluation (overval_pct_lag2, importance = 0.79), then lagged short-term debt and reserves (see Figure 1).
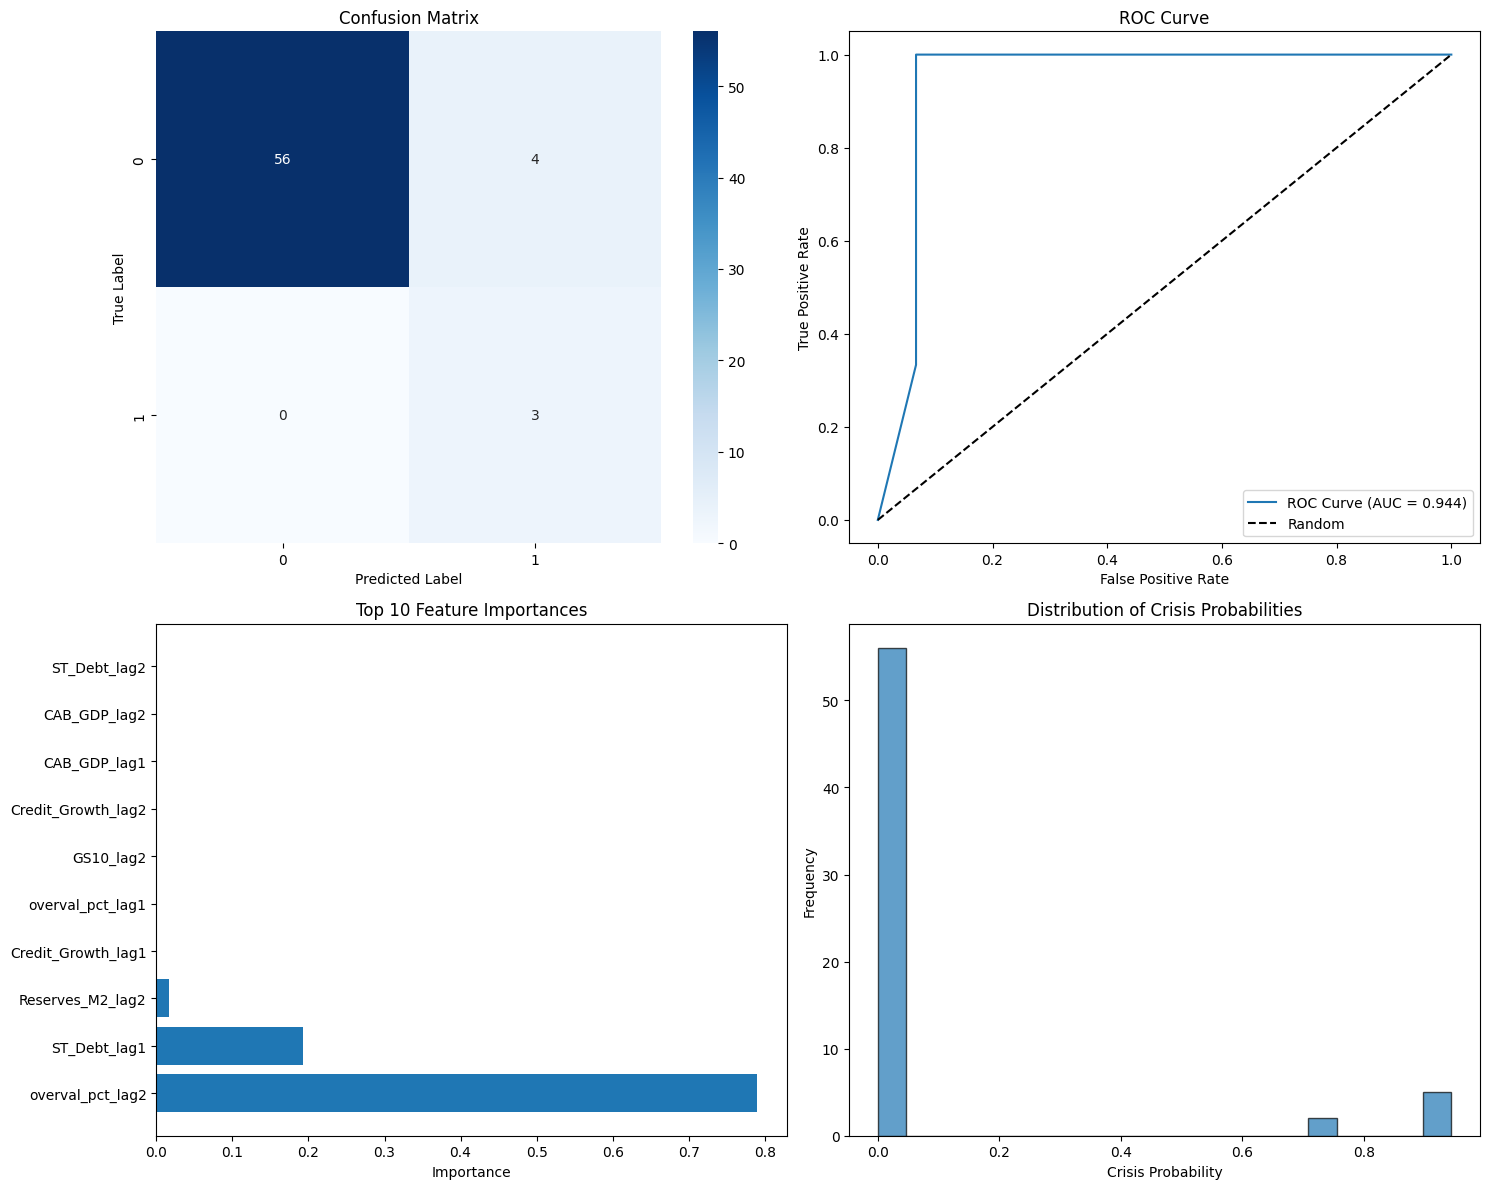
Figure 1: Pooled model feature importance and confusion matrix
The feature importance scores are:
- overval_pct_lag2 (0.79)
- ST_Debt_lag1 (0.19)
- Reserves_M2_lag2 (0.02)
These results support previous findings that a real exchange rate misalignment is a significant indication of crises, and reinforces the need to consider a country’s external debt and adequacy of reserves.
Country-Specific Models
Argentina:
- 64 observations, 8 crises, Test AUC = 0.464 (out-of-sample)
- Top predictor: CAB_GDP_lag2 (importance = 0.81), second lagged Reserves_M2_lag1
- Interpretation: Argentina’s significant current account deficits along with declining reserves are a leading indicator for the presence of crises, a feature of the country’s past reliance on “twin” crises.
Brazil:
- 47 observations, 4 crises, Test AUC = 0.5
- Top predictor: Credit_Growth_lag2 (importance = 0.76)
- Interpretation: In Brazil’s case, the risk of crisis may be related to the system of external borrowing and recovery. The rapid increase in credit or short-term liquidity is probably more important than the exposure to external risk.
Mexico:
- 69 observations, 4 crises, Test AUC = 1.0 (likely overfit check sample size)
- Top predictor: overval_pct_lag2 (importance = 1.0)
- Interpretation: The country demonstrating a large and/or ongoing overvaluation is a tell for the adaptation of the economic adjustment, where a surplus of overvaluation exists.
Turkey:
- 69 observations, 4 crises, Test AUC = 0.5
- Most important predictor: ST_Debt_lag1 (importance = 1.0)
- Explanation: Short-term debt is the most critical vulnerability, consistent with recent events.
Indonesia:
- There is not enough crisis data to allow for a reliable model estimation.
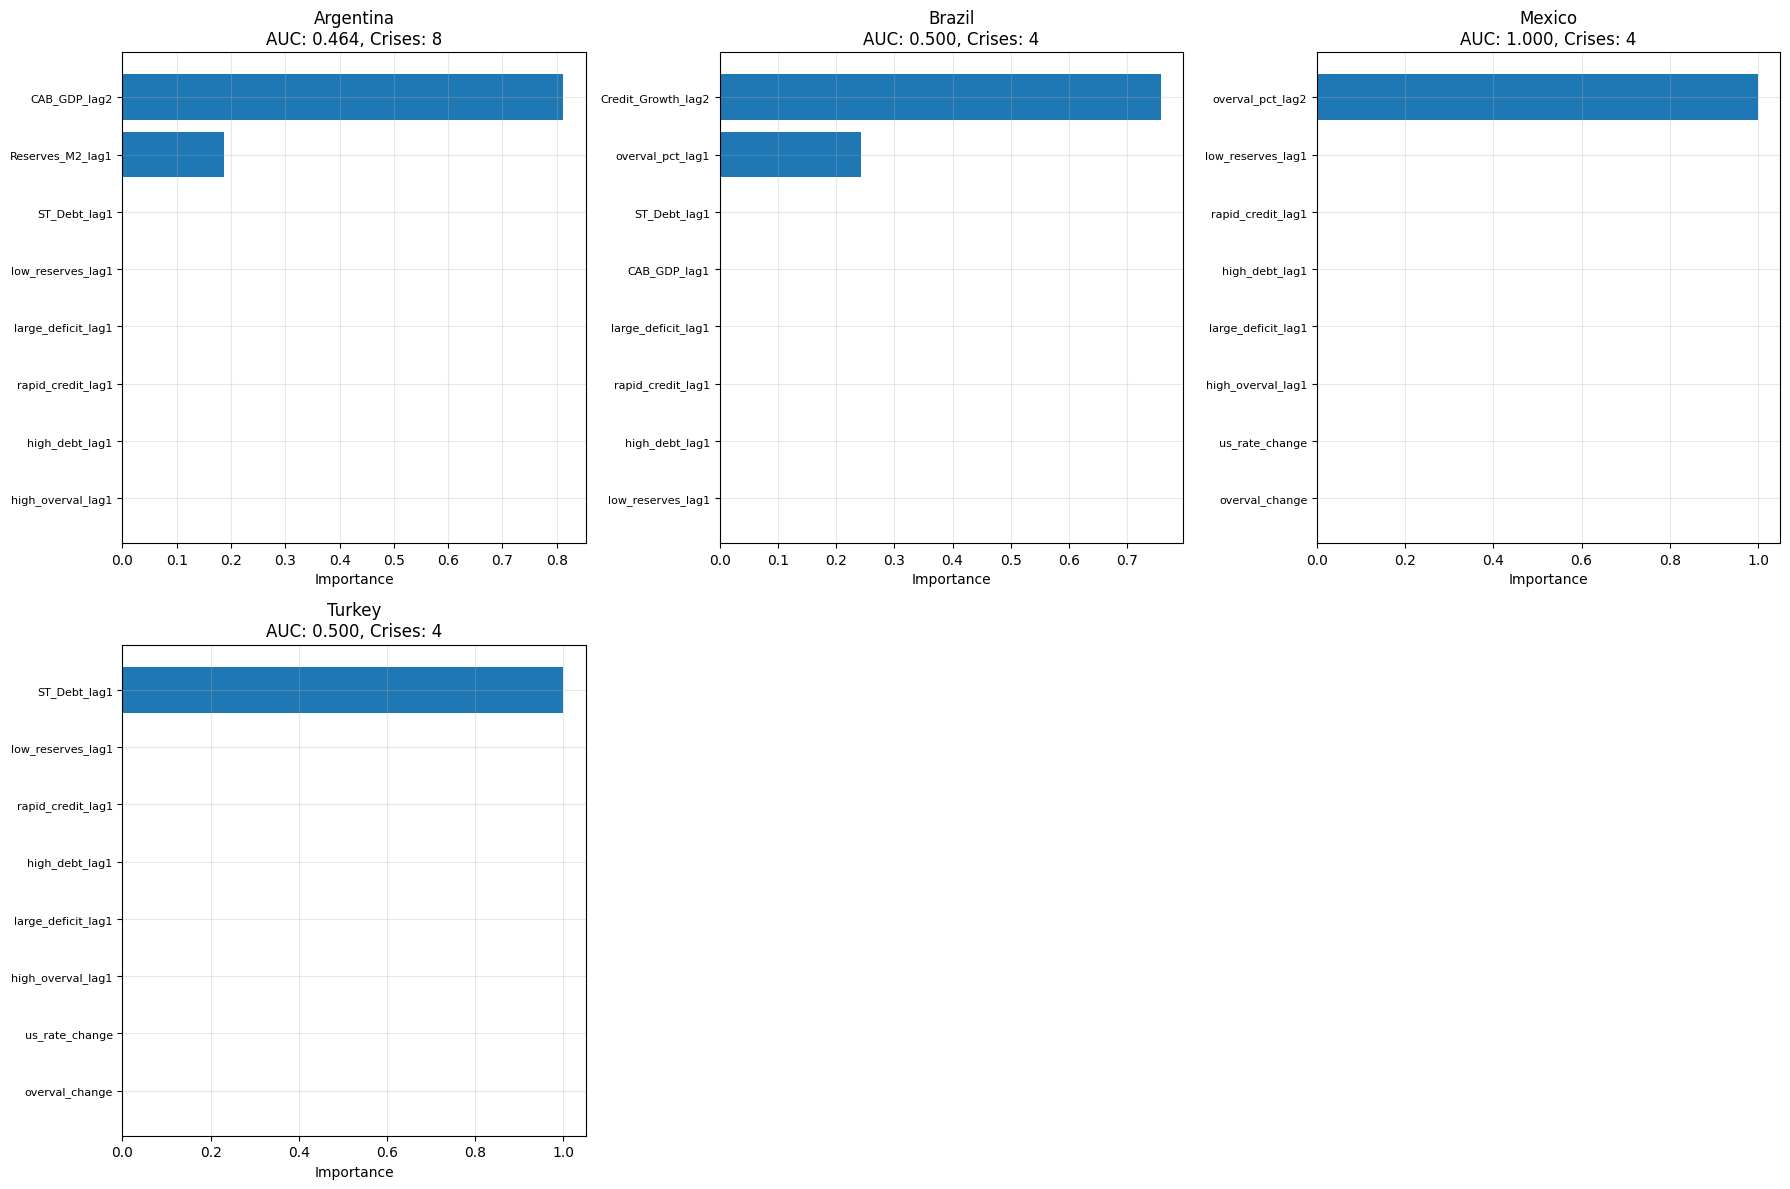
Figure 2: Country Feature Importance
Overvaluation Patterns
Figures 3-7 show the time series overvaluation of the real exchange rate for all countries. Overvaluation episodes appear to clearly precede the majority of crisis events, and when the crisis dummy coincides with overvaluation, there are large positive deviations from the trend. The conclusion is that overvaluation is a predictor is consistent with both theoretical and empirical studies.
Below is the overvaluation of the real exchange rate for Argentina. We can see clear rise in overvaluations during multiple crises: mid-1970s, mid-1980s, 1990, mid-2000s, and a couple of small crises just recently.
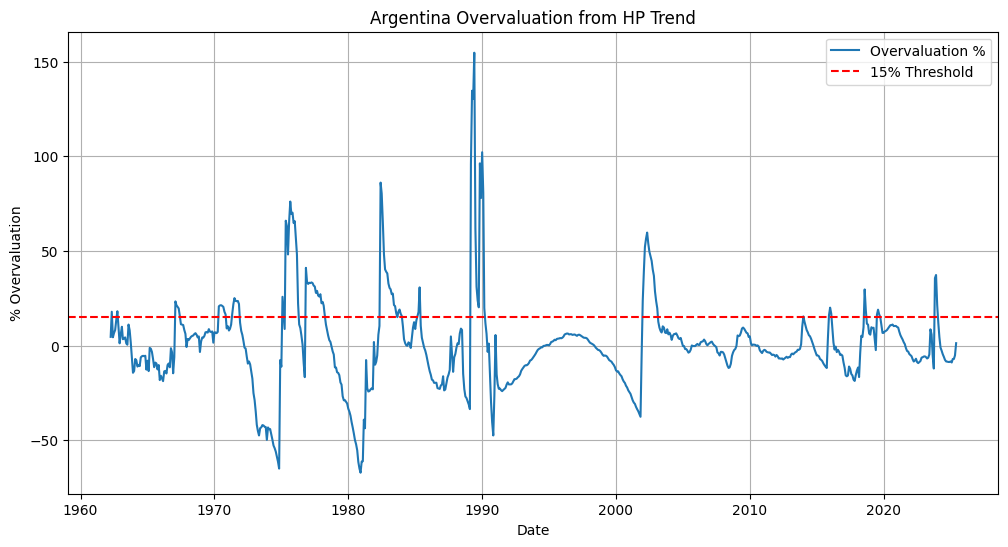
Figure 3: Argentina overvaluation from HP trend
Similarly, we can also see Brazil and Indonesia’s overvaluation from the HP trend. We can see that Brazil had multiple crises with the most disastrous happening in 1994. Indonesia only faced one crisis which is why country specific analysis was not possible however, it was devastating enough that it was important to include for the pooled model.
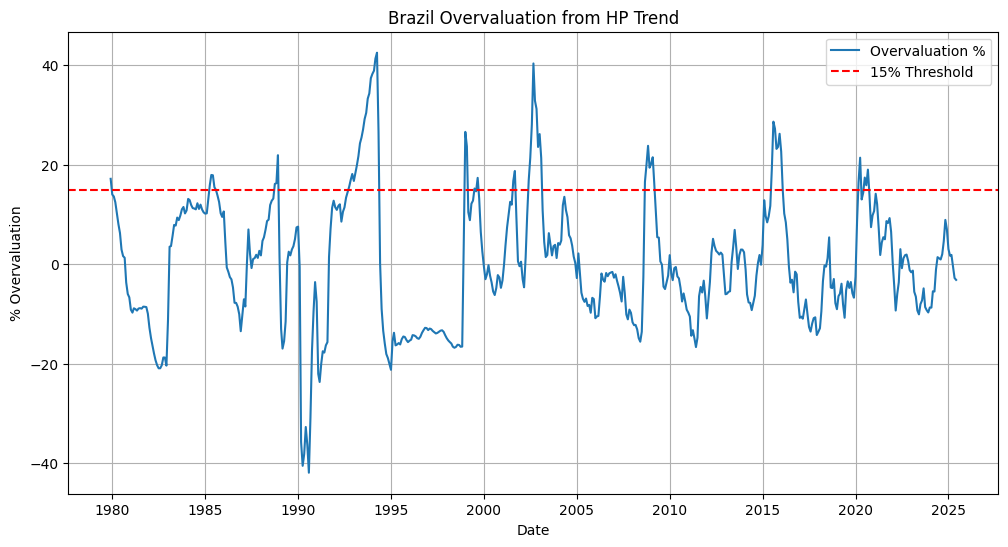
Figure 4: Brazil overvaluation from the HP trend
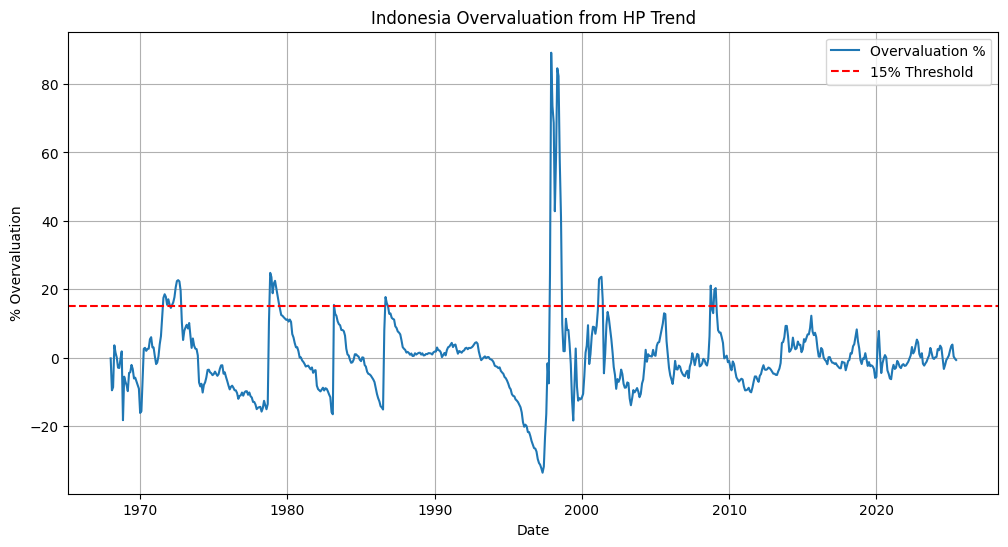
Figure 5: Indonesia overvaluation from the HP trend
The same can be seen for Mexico and Turkey. Mexico had multiple large crises in the 1970s, 1980s, and the 1990s after which the scale of the crises had actually calmed down. In comparison, Turkey’s Lira has had a volatile past which still seems to be continuing into the present. The volatile nature of the Lira from the start has been a main reason as to including Turkey for this research.
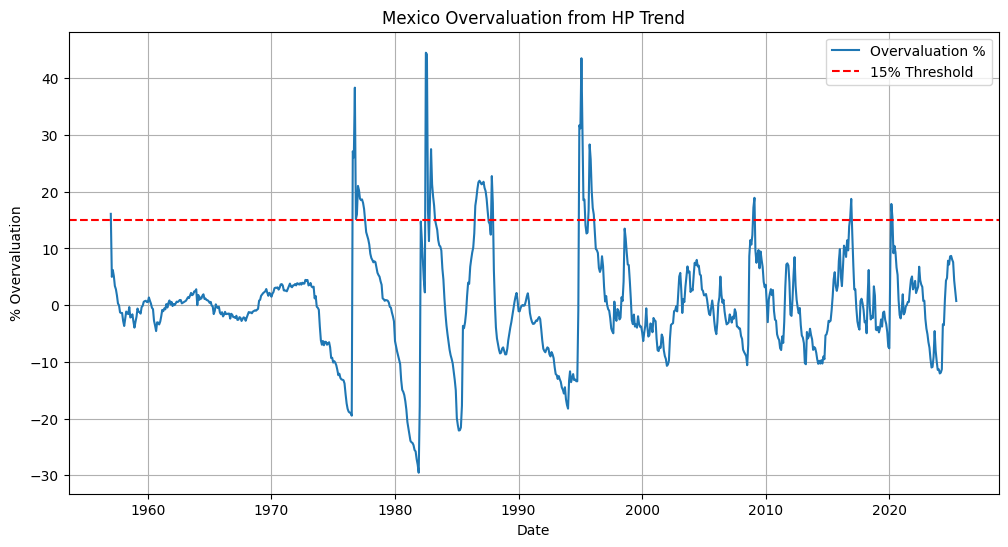
Figure 6: Mexico overvaluation from HP trend
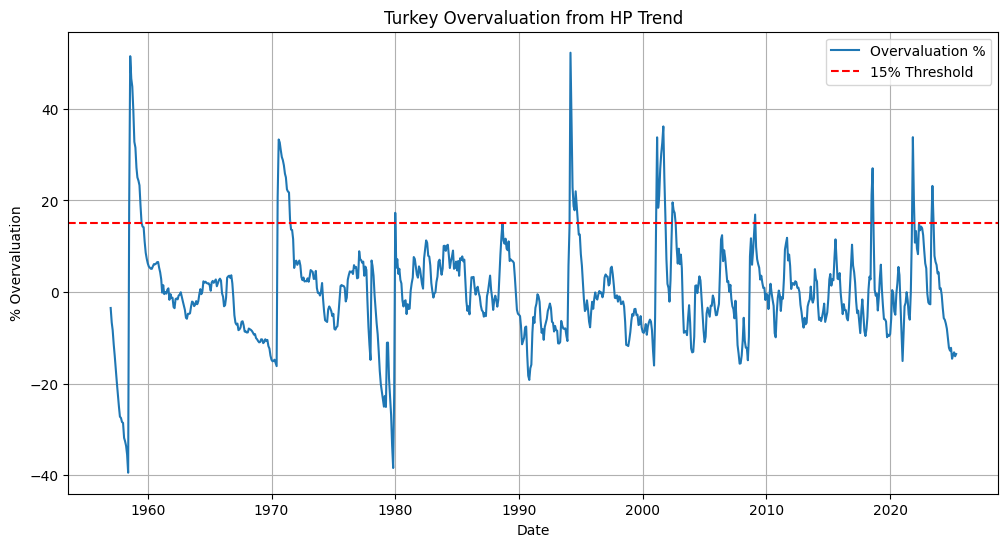
Figure 7: Turkey overvaluation from HP trend
Limitations of Models
- Sample Size: The number of crisis years is limited, especially at the level of a country. Therefore, reliability and generalizability are limited. This can be improved by taking more countries especially from the developed economies that might have older data available.
- Set of predictors: This model addresses observable macro-financial variables only and does not account for political or institutional factors.
- Data Quality: The credibility of the results is dependent on consistency in measuring mistakes in exchange rates or financial variables.
- Threshold decisions: The results reported are dependent on the choice of crisis threshold; other definitions of crisis criteria may yield different crisis years.
- Temporal stability: Relationships may vary from crisis to crisis due to structural changes or reforms.
- Overfitting: High AUCs in-sample or for small test sets are likely related to overfitting of some type of model, especially in circumstances where systemic crises may be infrequent.
Conclusions
This investigation leads to reaffirmation of the role of real exchange rate overvaluation as a leading indicator of currency crises in emerging markets in both pooled and country-specific models. The situation, to be sure, will vary across countries in terms of the factors contributing to the risk of a crisis: for Argentina, external imbalances and reserves are important; for Brazil, domestic credit; for Turkey, external debt; for Mexico, long periods of overvaluation.
The policy-related conclusion is that early warning systems will need to be unique to each country instead of a single universal approach. Early warning systems will have to integrate macro-financial indicators with the specific context. With the data limitations considered so far, any results have to be taken with caution; in the future, the research should ideally incorporate more frequently sampled data, consider more expansive variables, and machine learning options.
References
Alessi, L., & Detken, C. (2011). Quasi real time early warning indicators for costly asset price boom/bust cycles: A role for global liquidity. European Journal of Political Economy, 27(3), 520-533.
Berg, A., & Pattillo, C. (1999). Predicting currency crises: The indicators approach and an alternative. Journal of International Money and Finance, 18(4), 561-586.
Demyanyk, Y., & Hasan, I. (2010). Financial crises and bank failures: A review of prediction methods. Omega, 38(5), 315-324.
Eichengreen, B., Rose, A., & Wyplosz, C. (1996). Contagious currency crises. NBER Working Paper No. 5681.
Frankel, J. A., & Saravelos, G. (2012). Can leading indicators assess country vulnerability? Evidence from the 2008–09 global financial crisis. Journal of International Economics, 87(2), 216-231.
Gourinchas, P. O., & Obstfeld, M. (2012). Stories of the twentieth century for the twenty-first. American Economic Journal: Macroeconomics, 4(1), 226-265.
Kaminsky, G., Lizondo, S., & Reinhart, C. (1998). Leading indicators of currency crises. IMF Staff Papers, 45(1), 1-48.
Kaminsky, G., & Reinhart, C. (1999). The twin crises: the causes of banking and balance-of-payments problems. American Economic Review, 89(3), 473-500.
Krugman, P. (1979). A model of balance-of-payments crises. Journal of Money, Credit and Banking, 11(3), 311-325.
Krugman, P. (1999). Balance sheets, the transfer problem, and financial crises. In International Finance and Financial Crises, Kluwer Academic Publishers, 31–44.
Mendoza, E., & Terrones, M. (2008). An anatomy of credit booms: Evidence from macro aggregates and micro data. NBER Working Paper No. 14049.
Obstfeld, M. (1996). Models of currency crises with self-fulfilling features. European Economic Review, 40(3-5), 1037-1047.
🔗 Repository
Source code and materials are available on GitHub:
👉 Currency crisis Repository